
Descending Triangle Pattern: A Practical Trading Guide
- 10 hours ago
- 6 min read
A chart can look quiet just before an important move. The descending triangle pattern captures that tension: sellers repeatedly accept lower prices while buyers defend one support zone.
The pattern has a bearish bias, but it is not a promise of a fall. Price can break upwards, produce a false breakdown or remain range-bound. A useful descending triangle trading strategy therefore combines structure with a candle close, volume, market context, liquidity and strict risk control. Treat the pattern as a decision framework—not a standalone signal.
What Is a Descending Triangle Pattern?
A descending triangle is a price-consolidation pattern formed by two converging boundaries:
a downward-sloping resistance line connecting a series of lower highs; and
a broadly horizontal support zone connecting repeated lows.
The lower highs show that buyers are unable to lift each rebound as far as the previous one. Meanwhile, demand around support temporarily absorbs supply. Because selling pressure appears to be advancing while support stays fixed, technicians usually give the formation a bearish bias.
Support is a zone, not necessarily one perfect price. Small wicks through it do not automatically invalidate the structure. The swings should be clear, repeatedly respected and leave enough room to trade after costs and slippage.
How the Pattern Forms: Buyer–Seller Psychology
Imagine a share repeatedly finding buyers near ₹980. The first rebound reaches ₹1,080, the next ₹1,045 and the next ₹1,020. Buyers still defend ₹980, but sellers enter earlier on every rally.
Each support test can consume demand. Without fresh buyers, a break below ₹980 may trigger stops, attract short sellers and prompt buyers to exit, accelerating a bearish descending triangle breakout.
If sellers exhaust themselves, price may instead break above falling resistance and attract short covering. Trade the confirmed direction, not the expectation.
Descending Triangle Pattern Rules: Identification and Validation
Use these practical rules rather than trying to find textbook-perfect geometry:
Mark support. Look for at least two clear reactions around a similar level.
Connect lower highs. Link at least two meaningful swing highs without cutting through much price action.
Check convergence. The two boundaries should move towards an apex. A falling channel is different because both boundaries slope down.
Assess context. Check the broader trend, higher-timeframe levels and the stock’s sector or crypto market direction.
Demand confirmation. For a bearish trade, prefer a candle close below support—not merely an intrabar wick. For a bullish trade, seek a close above descending resistance.
Check liquidity. Thinly traded shares and small crypto tokens are more vulnerable to erratic wicks, wide spreads and slippage.
Volume, Candle Closes and Retests
Volume often contracts during formation and may expand on a breakout. Expansion shows participation but is supporting evidence, not a rule. Crypto volume is fragmented, so use one reputable source consistently.
A close beyond the boundary filters some false moves. Match confirmation to the trading timeframe: five-minute intraday, daily for a swing trade or weekly for a position trade.
After a bearish break, price may retest former support as resistance. Rejection can provide a cleaner entry. Retests are not guaranteed; chasing price can ruin the risk-to-reward ratio.

Using the Pattern Across Timeframes
The same logic applies across markets and periods, but execution changes:
Intraday: quick setups but more noise from the open, news and quiet periods. Use liquid instruments and realistic slippage.
Daily: clearer levels and more planning time, but overnight gaps remain a risk.
Weekly: slower signals and wider stops, usually requiring smaller positions.
Use a higher timeframe for trend and major levels, then the trading timeframe for confirmation. Do not widen a failed five-minute trade to a weekly stop.
Bearish Breakdown and Bullish Breakout Scenarios
Bearish breakdown
The conventional setup is a close below support. Expanding volume, a solid candle body, broader-market weakness and a failed retest strengthen the case. A close back inside warns of failure.
Less-common bullish breakout
Price can close above descending resistance. Rising volume and a successful retest improve confirmation. Add the triangle’s height to the breakout area for an upside objective; this invalidates the bearish thesis but does not prove a lasting uptrend.
Entry Methods and Trade Management
Aggressive entry
Enter after the first decisive close beyond support. This may capture a better price but carries greater false-break risk. Beginners are generally better served by waiting for the close.
Conservative entry
Wait for a retest of broken support and bearish rejection. Confirmation is stronger, but price may never return.
Define invalidation before entry. A bearish stop may sit above the retest high, above support plus a volatility buffer, or above the latest lower high. Let structure set the stop, then reduce position size to fit the risk budget.
Position size can be calculated as:
Maximum rupee risk ÷ risk per share or coin = position size
Maximum rupee risk equals account value multiplied by the risk percentage. Round down, account for charges and slippage, and keep notional exposure and leverage acceptable. Do not force a reward ratio when nearby support makes the target unrealistic.
How to Calculate the Descending Triangle Target
Measure the vertical distance between the highest high and horizontal support at the widest part of the triangle. For a bearish break:
Target = support (or breakout reference) − triangle height
For example, if the highest high is ₹1,080 and support is ₹980, the height is ₹100 and the conventional target is ₹880. Some platforms project the height from the precise breakout price, producing a slightly different figure. Pick one method in advance and use it consistently.
The measured move is an estimate. Mark intervening support and manage exits according to a tested plan.
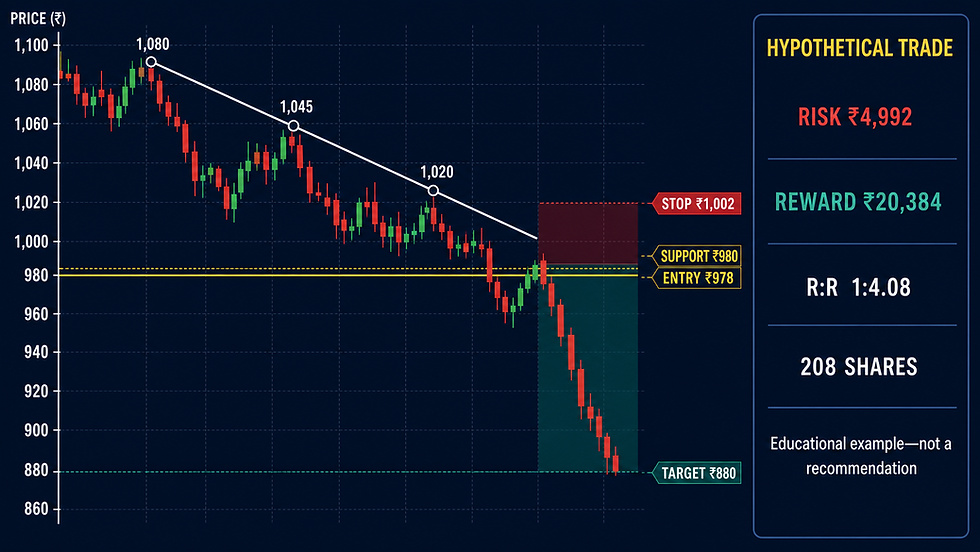
Complete Hypothetical Trade Example
This example is hypothetical and excludes charges and slippage. A liquid share forms lower highs at ₹1,080, ₹1,045 and ₹1,020, with support at ₹980. It closes below support, then retests the level and rejects it.
Account value: ₹5,00,000
Risk limit: 1% = ₹5,000
Conservative short entry: ₹978
Stop-loss above retest high: ₹1,002
Risk per share: ₹1,002 − ₹978 = ₹24
Triangle height: ₹1,080 − ₹980 = ₹100
Measured target: ₹980 − ₹100 = ₹880
Position size: ₹5,000 ÷ ₹24 = 208.33, rounded down to 208 shares
Actual planned risk: 208 × ₹24 = ₹4,992
Reward per share: ₹978 − ₹880 = ₹98
Potential reward: 208 × ₹98 = ₹20,384
Planned risk-to-reward: ₹4,992:₹20,384, or approximately 1:4.08
The notional short is ₹2,03,424. Reduce size if charges and slippage push risk above ₹5,000. The target can fail, gaps can exceed the stop, and short-selling or borrow rules may constrain execution.
False Breakdowns, Failed Patterns and Warning Signs
A false breakdown moves below support but quickly reclaims it. Warning signs include:
only a wick below support, followed by a close inside the triangle;
weak participation or an immediate reversal despite high volume;
a breakout directly into strong higher-timeframe support;
repeated boundary breaches, making the pattern poorly defined;
a move very near or beyond the apex, after compression has lost relevance;
illiquidity, wide spreads or a news-driven spike; and
bullish divergence or broader-market strength contradicting the short thesis.
High volume can also mark capitulation. If price reclaims support and breaks the last lower high, the bearish structure has weakened. Honour the predetermined exit.
Common Mistakes Traders Make
Entering before confirmation because the shape “looks bearish”.
Drawing support as an exact line and ignoring the surrounding zone.
Treating a wick as a confirmed descending triangle breakout.
Ignoring the higher-timeframe trend, news, liquidity or nearby levels.
Assuming every retest will hold—or that every breakout will retest.
Using the measured target without checking intervening support.
Choosing size first and moving the stop to fit the desired loss.
Widening the stop after entry.
Applying leverage without accounting for liquidation, gaps and funding costs.
Descending vs Ascending vs Symmetrical Triangles
Pattern | Upper boundary | Lower boundary | Typical bias | Confirmation |
Descending triangle | Falling lower highs | Horizontal support | Bearish, but can break either way | Close below support or above falling resistance |
Ascending triangle | Horizontal resistance | Rising higher lows | Bullish, but can break either way | Close above resistance or below rising support |
Symmetrical triangle | Falling highs | Rising lows | Neutral; often treated as continuation | Close beyond either converging trendline |
Geometry suggests pressure, not certainty. Confirmed direction, context and risk matter more than the label.
Step-by-Step Descending Triangle Trading Checklist
Identify clear lower highs and a repeated horizontal support zone.
Confirm that the boundaries converge and the instrument is liquid.
Mark higher-timeframe trend, nearby levels, scheduled news and market context.
Calculate the height and map both breakout scenarios.
Wait for a candle close beyond a boundary on the trading timeframe.
Compare breakout volume with recent volume; do not use it alone.
Choose a close-based entry or wait for a retest and rejection.
Set the invalidation level and calculate risk per unit.
Size from maximum account risk, rounding down for costs.
Check reward to the first meaningful obstacle and the measured target.
Place orders according to the plan; never widen risk impulsively.
Record the setup, execution and outcome for review.
Conclusion
The descending triangle pattern maps pressure: sellers create lower highs while buyers defend horizontal support. Its bearish bias becomes tradable only after confirmation and with sensible risk.
Mark zones carefully, wait for closes, use volume and retests as supporting evidence, respect market context and size every position from the stop-loss—not from conviction. A measured descending triangle target can guide planning, but disciplined exits and capital protection decide whether the strategy is sustainable.


Comments